Sunday, November 18, 2012

Data Visualization


   Earlier in November, I mentioned that I wanted to do a post on MOOCS, Massive Online Open courses.  I still want to do that post, but once again, another topic has pushed a discussion about MOOCs further into the calendar year.

   Data Visualization, or Data Viz, is an emerging technology field that combines skills connected with three fields: communications, design and programming.  My guess is that if you’re reading this, you’ve seen many examples of Data Viz, especially after this recent election cycle.  Data Viz takes a data set and portrays it visually.  These infographics are often eye-catching.  Additionally, many are interactive, allowing the viewer to control the data that is viewed or create an opportunity to see a relationship between sets of data.

   It may sound a bit complicated, so it might be helpful to think of Data Viz as graphs and charts on steroids.  In the Data Viz world, programmers attempt to give viewers new and useful ways to examine data. The premise is that a well-crafted visualization may allow a viewer to understand a data-driven topic in a new and useful way.

   Here’s an example that portrays relative incidences of a number of diseases as they are found around the world. 

For a full look at this visualization, click here.
   Mike Bostock works for the NY Times and is responsible for many of their notable data visualizations.  Bostock's  map of Hurricane Sandy’s wind speeds as the hurricane came ashore might be of interest, given recent events. Click on the “Next” button towards the top of the map to see the information change over time.

For a full look at this visualization, click here. Click on the “Next” button towards the top  of the map to see the information change over time.
   Treemaps are one fairly familiar data visualization type.  Here, a finite amount of data is first divided into component parts. Then, these parts are represented by different sized sections proportionally to the total data set. In the following example, the US stock market is divided into categories of stocks (health care, financials, consumer goods, etc.) and these sections are further divided. Scrolling over this treemap yields deeper market data. See for yourself right here.


   This outstanding example pops up now again as someone’s emailed favorite: http://www.gapminder.org/world/  It is really beautifully done and shows how, with the right representation of data, new understanding is created.  In this case, the relative wealth of nations as it connects to life expectancy is portrayed over the last two centuries.

   It’s worth considering that Data Viz (also known as DV to insiders) is a growing field of academic study. Course work, and even concentrations within majors, has become part of computer science programs and design programs.  Journalists, social scientists, graphic designers and scientists increasingly find DV part of their field.  My guess is that it won’t be long before data visualization finds its way into high school curricula.

   Interested in  exploring the topic further?  There are many sites to check. Here are a few to get you started.


Sunday, November 4, 2012

Taken For Granted

   I was all set to write about MOOCs - Massive Online Open Courses.  I've been paying attention to the phenomenon for  a year or two.  Last month, the Chronicle of Higher Education ran a cover story on their growing importance.  And just this week-end, MOOCs occupy the cover of the Sunday N.Y. Times education supplement.  But MOOCs will have to wait.
   Hurricane Sandy struck a week ago.  There is simply nothing I can add to the coverage, the images and the accounts of the devastation.  It's been a tragic, trying time in the NY metropolitan area and everyone in the GSB community has been affected.  And has been widely noted in our area, the storm follows a series of other weather-related events, all in the fall and all in very recent memory.  The freak October snow storm that hit Schooley's Mountain and Washington Township so hard.  Hurricane Irene.  The Halloween snow storm. And now Hurricane Sandy.  Though each was a separate weather event with its own set of characteristics, all induced widespread power outages that exposed our collective vulnerability to power loss.  
   We are extremely dependent on a secure and unlimited source of electricity. When it is unavailable, we quickly lose an ability to communicate effectively, to transport ourselves, to feed and to warm ourselves.  Speaking from personal experience, it's amazing how quickly you feel somewhat disassociated from not only the routines of your life, but from societal norms. And when it is available, it immediately is forgotten, simply part of our landscape, no more noteworthy than the oxygen in the air.
   So I decided to devote a short post to the people who had a lot to do with the research and the creation of devices that have allowed us to use electricity for practical purposes.  Especially this past week, we're acutely aware of how much we have come to depend on their collective work. You may dream of a life that is free of electrical dependence, but it's unlikely you'll live that life.
   A quick search turned up a list of people that form a continuous thread of electrical understanding.  Some did pure research and others were driven to find practical applications for electricity. I'll just list names.  If someone is unknown to you, take this as an opportunity to find out a bit more about electricity. It's one way not to take it for granted.  By not taking it for granted, it is more likely you'll pay more attention to policy debates about how best to provide for our substantial, and growing appetite for electricity.

Can you match the names and the portraits?
 
Benjamin Franklin
Alessandro Volta
Michael Faraday
Georg Ohm
Hippolyte Pixii
Joseph Henry
Thomas Davenport
Sir William Grove
James Joule
Samuel Morse
Charles Brush
Thomas Edison
Nikola Tesla


Tuesday, October 16, 2012

Time-Lapse Photography: Videos Telling a Story Over Time

   I've long been a fan of time-lapse photography.  Who isn't?  It's fascinating and somewhat hypnotic.  There's just something about the ability to compress time and view the results with a click of the mouse.
   There is no secret to creating time-lapse content.  It begins with a subject, the focus of your video.  The subject should change over time, and you should have the ability to repeatedly photograph that subject over the required length of time.
   Let's say you're a science teacher and the class is beginning an exploration of botany.  Discussing phototropism, a plant's natural tendency to seek light, will help students to learn the concept.  But creating a film in the classroom by repeatedly photographing a plant on a windowsill through the day may carry a greater learning impact.  Students can see for themselves that plants actually move quite a bit in the course of a day in response to external conditions such as light.
   It is helpful to know some basics about time-lapse photography.  The typical time-lapse video has about 20-30 frames per second.  The more frames per second, the smoother the transitions appear.  But more frames per second involves more time and more work; most filmmakers feel comfortable with a middle ground between choppy results and an overly time consuming project.
   Well produced time-lapse films involves a fixed camera.  Mounting a camera on a tripod or other solid platform and leaving it untouched through the production is important.  Sometimes, it's not possible to avoid a camera relocation.  Though it will change the overall impression of the film, a time-lapse project is still the result.
   How does a filmmaker take 20-30 shots per second over hours, days or even longer?  There are tools for this tedious task.  Cameras are now sold specifically to produce time-lapse sequences. (Here is one example: Brinno TLC200) Timers can be attached to cameras and set to trigger the shutter as needed by the user.  (If you're really interested, search this term: intervalometer.) Given these tools, it would be uncommon for a filmmaker to stand by a camera and manually release the shutter over and over again in order to produce time-lapse content.
   Time-lapse work can be more than just fun.  It can help shed light on areas as diverse as science, construction engineering and project management.
   The University of Indiana's Professor Roger Hangarter (Department of Biology) experiments extensively with time-lapse photography in helping to understand plant life. His web site is full of searchable time-lapse videos of plants in motion.
    A construction engineer might want to study the process by which a building is built. Though many tools exist on a micro-level, few macro-level tools are helpful.  But a video like this could help with solving engineering challenges on the next skyscraper project:
 

   What about an individual who manages a project?  Especially if the project recurs, it's useful to look back and see what might be improved the next time. Here's a look at a recent Superbowl, including the arena "makeovers" during Superbowl week. 

   Finally, let's take a look at the addition to Founders on our campus.  The project began in late May and concluded in mid-October.  Approximately one photo was taken each day. In total, two camera perspectives were used.  The first set of photos was taken from a perch above the construction site.  The second set of photos was taken near the northwest corner of Hockenbury.  Though there are certainly not 20-30 frames per second in this video, it does provide the viewer with the ability to watch a multi-month construction process unfold in a couple of minutes.


   (Having trouble viewing the video? Click on The Founders Addition Project.)
 
   Beyond filming a plant on a windowsill, are there classroom applications?  A Health class could use a time-lapse video to decode which salad bar items are the most popular offerings?  A Statistics class could gather data on human behavior in a public setting. A World Language class could examine non-verbal communication cues as people converse.  In short, there are many opportunities to use time-lapse video; your curriculum and your imagination can point you towards the possibilities.

   Bonus content: this morning, a student showed me a very impressive time-lapse video.  The overall effect is stunning.  It's called Natural Phenomena.

Sunday, September 30, 2012

Science Learning is Deepened with the Right Tools

   When I heard about a package of learning tools - hardware and software - that was being utilized by Lynn Prosen and Teri Cosentino, I had to take a look.  Lynn, our Lower School science coordinator and Teri, our Middle School 6/7 science teacher, did training through the Liberty Science Center to enable GSB to borrow some equipment.  Here's Lynn at the controls of the learning tools:
Lynn's at the laptop managing software that determines what is shown on the globe in the background.

     The science lessons taught through the set-up are all based on data gathered by NASA satellites.  These satellites have been recording information about our planet as well as other planets and celestial bodies for decades.  As the data accumulates, it's possible to begin to see patterns of change over time.
      Want to see how the levels of chlorophyll change on Earth over the course of the last several years?  How about changes in ice pack as seasons come and go?  Interested in changes in gas densities on Saturn?  Or magnetic changes on Mercury?  Given the accumulated data, the possibilities for inquiry are virtually limitless.  As Teri said to me, "I'd love to create a course solely based on analyzing the data sets."
       What makes the data come alive is the hardware.  The data is put through a software tool that allows it to be projected on to a sphere.  In the photo above, the "Earth" is actually a translucent ball (about the size of beach ball), sitting atop a projector. The specially designed projector acts as a podium stand for the ball and also, through a series of mirrors, is able to project images on to the sphere.  These images can then be set in motion, so the Earth, or any other planet, will spin.  Students see a reasonable replica of a planet, spinning on its axis, illustrating wind, temperature or electron-magnetic changes, to give some examples.
       Below, a few more shots of the globe as it projects images from our solar system. The globe has not changed; the software controlling the projection is creating the image of the Sun, the Earth and Jupiter.


    The class I observed was a group of Sue Hone's third graders.  Their analytical skills were sharpened by a series of directed questions based on what they were seeing.  They were at first intrigued and then quickly were quite engaged in the lesson.  Here's a few shots of the young scientists hard at work:


       Though I did not get a chance to see a Middle School class, I did speak with Teri after her lessons.  Teri went through a full week of training at the Liberty Science Center over the summer to be fully ready to utilize the software to the fullest.  Though Lynn's preparation was not quite as extensive, both emphasized that the software was quite full-featured and training was necessary to make the most of the data NASA provides.  That said, I was still interested enough to check out the the web site, NASA Earth Observations, that houses the satellites' earth data.  It's definitely worth some "exploration time."

       By the time you read this the equipment will be gone from campus, but Teri tells me she's already reserved it for two weeks in December and two weeks in March.  If you are interested, it would be worth your while to find a way to see a demonstration.

       Want to see how it all looked the day I visited class?  Just click on Science in the Classroom.


Tuesday, September 11, 2012

Thinking about Technology

I didn't grow up working in technology.  I was a history major in college and spent most of my educational career as a history teacher and a college counselor.  As I enter into my fourth year as a "technology person," I remain awestruck by the capabilities of modern digital technologies.  Touch screens, streaming video, wireless networks and the such have become so familiar as to be taken for granted…unless they are not operating properly.  But surrounded by and working in our digital world, I remain amazed at what I am seeing.

So I work each day in technology, helping to create a web site, set up a projector or assist a teacher with a technology driven lesson.  But I'm also keenly conscious of this professional world I now inhabit because I came to it later in life and can see it with the fresh eyes of a relative newcomer.  Perhaps I'm more easily wowed than someone who has worked in the field for decades because he or she has grown up with the engineering changes.

Take a recent article in the New York Times (9/9/12).  The article offered an exhaustive look at the present and future of commercial space travel. Incredibly, to me at least, the article was in the Travel section.  Space travel is here, albeit only for the ultra-wealthy. 

This article and the idea of space travel provoked an interesting lunch conversation.  Money aside, "Would you go or not?" elicited the full range of responses.  More interesting was a collective musing over the world we live in where so many live in want, and a few can pay upwards of $100 million for a one-time thrill ride.  But all at the table understood that this article represented yet another instance where a technological threshold had been crossed.  Much like personal computers, cellular phones, touch screens and voice recognition, every few years we embrace (or grudgingly acknowledge) yet another technological leap forward.  


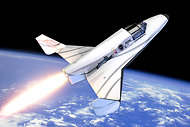
A rendering of XCOR’s Lynx suborbital vehicle. It would hold a pilot and a passenger. (from the NY Times, 9/7/12)
So many of these technological developments seem like magic.  Movies on demand brought to your 60" flat screen LCD 3-D TV via a satellite?  An internet-based music service that uses an algorithm to determine what songs you'd enjoy hearing based on an initial choice? The internet itself, with its billions of pages of content, creative outpourings from all over the globe, news, weather, video, etc.  E-books, with an ability to hold in your hand a small library's worth of books, and add to that library virtually instantly with a click or two.  Truly, it's amazing.

But there's a physicalness to this magic, a point thoroughly documented in Andrew Blum's TubesTubes is a book about the internet, but not in the usual abstract way.  It is about the physical, concrete internet, the set of optical fibers and routers and servers and switches and tubes that have created a world wide web.  It's also the story of how the internet was invented and yes, Al Gore gets his mention.  Long ago, in the early 1960's, computer scientists in the forefront of the field explored first creating computer networks and then linking networks together.  They were called internetworkers. We have inherited their vision.

As their work progressed, they needed physical places to link networks. And the networks needed physical places to house data.  In both instances, warehouse structures with enormous space were utilized for the requisite machinery.  And fiber, as well as existing phone lines, was needed to connect locations.  In short, an infrastructure was created and it continues to grow exponentially.  When today's internet is considered, its physical presence is never mentioned.  Yet over the last several decades, an infrastructure has been built that equals, in scope and importance, the national highway system of the 20th century and the railroad lines of the 19th century.
   
There are risks attendant to this change.  The risks can be as personal as cyber-bullying or as mundane as the knowledge that one has spent far too many hours playing video games or web surfing with little to show for it. James Steyer's book, Talking Back to Facebook, vividly points to many of these personal risks and reminds readers that youngsters are most vulnerable. 


The risks can occur at an entirely different scale as illustrated in Worm by Mark Bowden.  It's a story of our time in which cyber-security experts attempt to secure individual computers and networks from a particularly vicious global computer virus.  Here, one learns about how the underworld has seen technological change as an opportunity for profit. The book is a reminder that the computer networks we inhabit connect us in sometimes unexpected and dangerous ways.

And though it's unclear whether or not having your online data mined constitutes a risk or the end result of a commercial enterprise, personal data is being gathered at a furious rate from digital users.  This has become the true commercial backbone of the internet and it is frightening to many savvy users.  But phone owners, EasyPass subscribers and a great many other consumers in the digital world are ceding their privacy for the advantages of comfort and efficiency.

I've spoken to enough teachers over these few years to know that many feel a bit overwhelmed by the technological change they see.  That's not an admission of weakness or a characteristic of old age.  Rather, it represents an awareness.  If you're not feeling a little overwhelmed, you're not paying attention to the rate and quantity of change.  Unless you are a product editor for Wired Magazine, I would argue that it is impossible to fully keep up with the field.  But that's no reason to throw up your hands in defeat.  I really enjoy college basketball and pay attention as each season unfolds, but there are too many teams and players to stay on top of it all. I don't worry abut that.  I find parts of the whole I'm interested in and focus my attention there.  Find what works for you and utilize it wisely.  The technological world is remarkably interesting and ever-changing. It's worth exploring, but it's important to exercise caution as well.  So be curious, but be careful as well.


Interested in follow-up reading?

Space Tourism is Here! Wealthy Adventurers Wanted. McKinley, Jesse. The New York Times. 9/7/2012.

Tubes: A Journey to the Center of the Internet. Blum, Andrew. Ecco. 2012

Talking Back to Facebook: The Common Sense Guide to Raising Kids in the Digital Age. Steyer, James P. Scribner, 2012

Worm: The First Digital World War. Bowden, Mark. Atlantic Monthly Press. 2011.

"Data Snatchers! The Booming Market for Your Online Identity." Sullivan, Mark. PC World. August, 2012